Trend Analysis
Assume you haven't been checking the progress of deal closure for a while and suddenly notice a drop in the revenue due to less number of closures. Now, unless you monitor the status manually, there are chances that you will miss important details and fail to take action at the right time.
Additionally, Zia automatically detects and notifies you of any anomalies in these patterns. A sudden spike or a dip from what is normal to your business is called an anomaly. Zia catches these anomalies and sends you prompt notifications. You do not have to look for inconsistencies in your business processes manually anymore. Zia brings them to you automatically so you can identify the problem areas at the right time to take actions or find what's helping in the growth of your business so you can invest in it more.
Availability
Viewing Trend Dashboards
To view Trend Dashboards in Zoho CRM, go to Home > Dashboards > Trend Dashboards. The Trend Dashboards are categorized in two folders - Sales Trend and Sales Follow-up Trend.
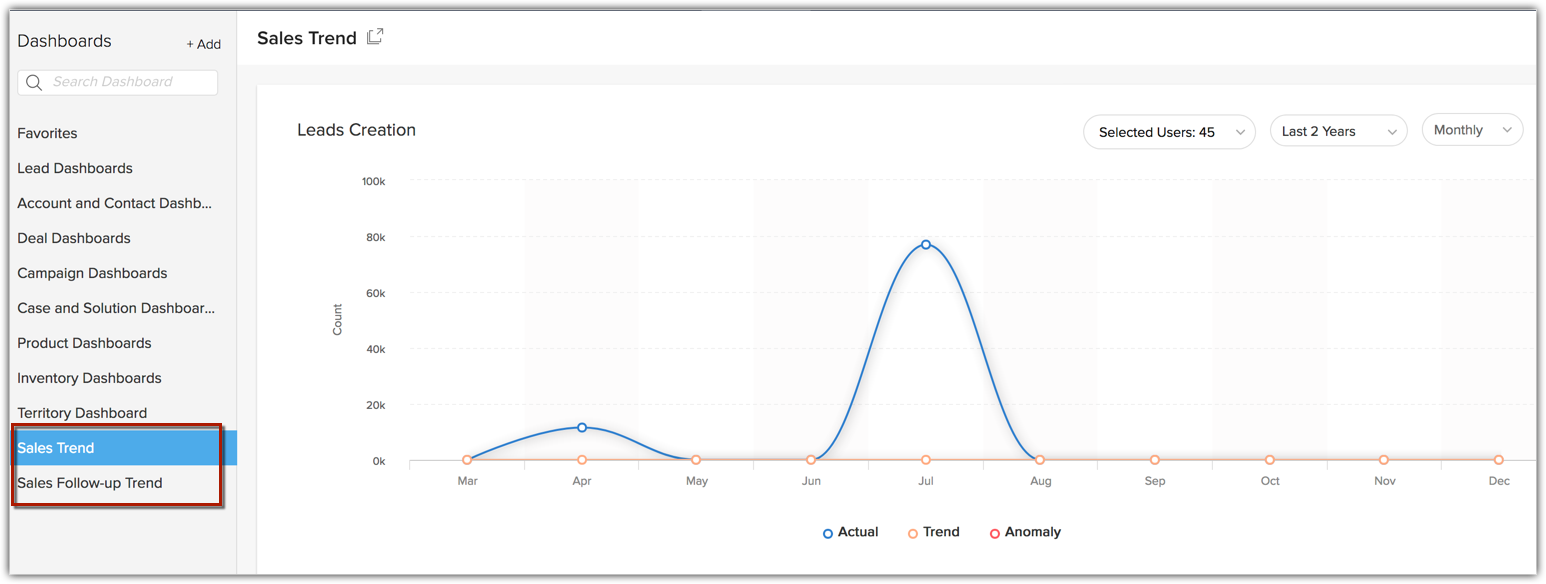
Zoho CRM currently provides eleven pre-built components in the Trend Dashboards folders. All these components are displayed as Line Charts to show trend over a period. You can only view these components but you can not modify them or add new ones.
List of Components
| Component Name | Description |
| Lead Creation | Leads that are created. |
| Lead Conversion | Leads that are converted. |
| Contacts Creation | Contacts that are created. |
| Deal Creation | Deals that are created. |
| Deal Closing by Count | Deals that are closing count. |
| Deal Closing by Amount | Deals that are closing by amount. |
| Task Closure | Tasks that are closed. |
| Events Creation | Events that are created. |
| Calls Completed | Calls that are completed. |
| Notes Creation | Notes that are created. |
| Email Sent, Bounced, Opened | Emails that are sent, bounced or opened. |
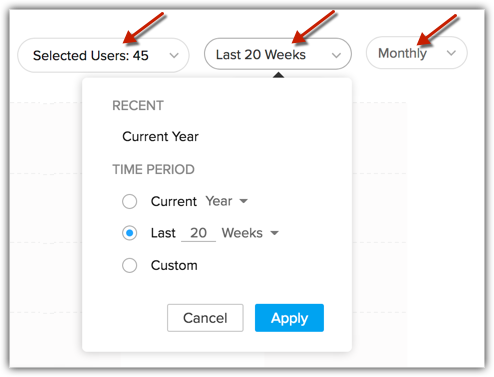
You can filter and view the trend of each dashboard based on Users or Groups and Time Period. You can see the trend for daily, weekly, monthly or yearly for the set time period. You can also select a specific portion of the graph to zoom in and view the trend of the respective time-line.
Let's take a closer look at the Leads Creation chart. It comes with three key components;
- The Trend line - The Trend line shows the pattern in which the given business metric is supposed to fare going by your past data.
- The Actual line - The Actual line shows how the given business metric is faring in reality as against how it is supposed to, shown in the trend line. It is this line that shows any spike or dip.
- Anomaly - A sudden spike or a dip from what is normal to your business is called an anomaly. The red circles in the chart denotes anomaly.
As you can see, there is a steep dip in the Actual Line in the above chart, which interprets that your Leads creation has decreased radically for the month as against the previous months. Zia identifies this as an anomaly and sends you a notification, while you can look into what has caused this and fix it.
Viewing Zia Notifications
To view Zia notifications, go to the Home page and click Zia icon in the bottom right hand side corner.
![]()
Zia shows the following types of notifications:
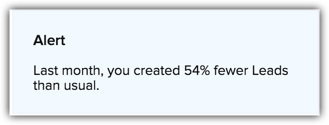
- Alerts: Alerts are usually based on Leads Creation. These alerts bring anomalies in Leads Creation count into your notice.
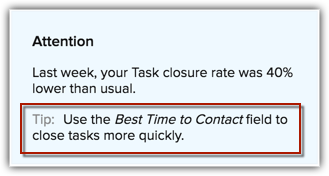
- Attention: This gives you the status of your current sales metric as against the trend. These notifications could be based on your Team's performance or yours. They usually come with Tips. Attention could also be based on your Workflow Rules.
- Tips: Tips are given based on the root cause of the anomalies. Say for example, when there is a drop in your tasks closure rate, the tip will be to increase the frequency of you follow-up activities or make use of the Best time to Contact field for faster tasks closure.

- Basis the historical data, Zia also takes into account seasonal effects of your work pattern to project trends. For example, the system will not show anomalies for your weekends once it identifies the pattern in your work routine.
- With more data going into your Zoho CRM, Zia predictions get more accurate.
- The Zia notifications stay for a time period of 15 days, after which they get erased.
Related Articles
Quadrant Analysis
What is quadrant analysis? You can measure or compare a limited set of business data using a chart or KPIs, but if you have a large amount of data and want to pinpoint the areas to focus on, a quadrant analysis may be more suitable. Quadrant analysis ...Cohort Analysis
What is cohort analysis? Cohorts are groups of users, customers, or data that share similar characteristics at any given point of time. Cohort analysis can be helpful for understanding customer behavior across the sales life cycle or their buying ...Zone Analysis
A company's CRM account includes a huge amount of business-related information, including customers' interests and buying patterns, sales cycle duration, rate of completion of sales activities, and sales velocity. A thorough exploration of this data ...Email Sentiment Analysis
Sales team receive hundreds of emails every day but the ones that have a negative tone usually require an immediate attention over the others. But to identify the emails that need to be prioritized or require immediate attention, a rep has to leaf ...What is the difference between Quadrant analysis and Zone analysis?
Both Quadrants and Zones offer a convenient graphic that lets you plot data points in areas which you define. But they differ in the way they represent data: Quadrants offer graphs which are divided into four main sections. Zones, provide an option ...