Ticket Status Dashboard
The Ticket Status Dashboard is designed to provide an easy to understand view into the status of all tickets received in your help desk. It displays the number of tickets under each status and states, the average amount of time a ticket stays in status, and the number of tickets reopened over the chosen period. All these metrics enables you to monitor daily ticket activity, agent efficiency, average handle times, and so on.
Note:
- Ticket Status dashboard is not available on the Free edition.
Accessing the Status Dashboard
The Ticket Status Dashboard can be accessed from under the Dashboards tab in your help desk account.
To access the dashboard:
- Click the Reports module.
- In the Reports Overview page, click the Dashboards tab from the left panel.
- On the Dashboards List page and under the Popular Dashboards folder, click Ticket Status Dashboard.
Components of Status Dashboard
The Status dashboard is made up of the following components:
- Open Tickets by Status
- Tickets by State
- Re-opened Tickets
- Average Handle Time by Status
Open Tickets by Status
Tickets can be into different statuses depending on the various stages in your support process. It is essential that you keep an eye on how many tickets are existing under each status at any time. This chart provides a visual oversight of your open tickets by their current status. It displays a bar for each status with the length of each bar indicating the number of tickets in that status.

Note:
- The chart shows real-time stats regardless of the reporting period.
- The chart displays data for statuses mapped to the Open and On hold states.
Tickets by State
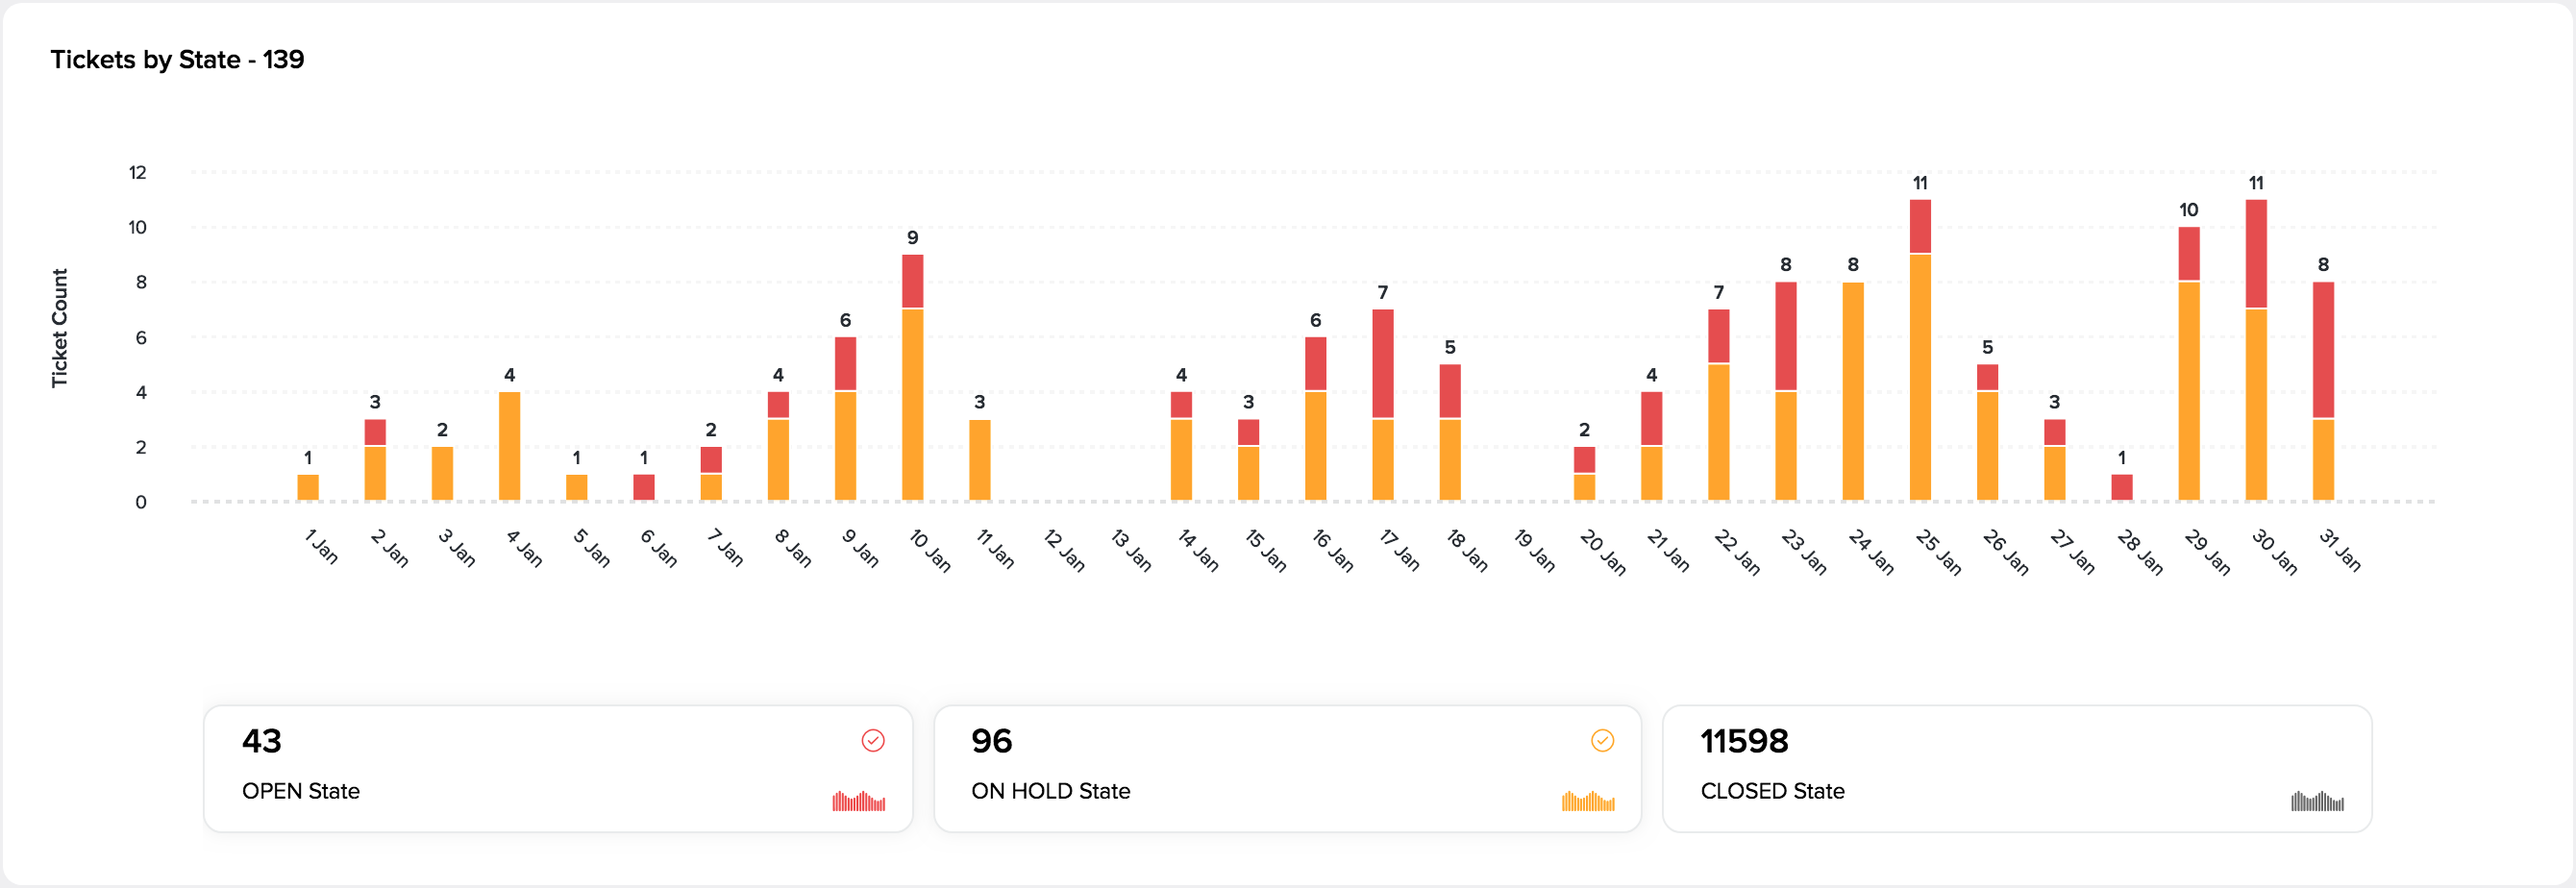
All Zoho Desk tickets can be in one of three states: Open, On hold, or Closed. It's important to keep track of how many support tickets created during the selected date range are still in one of the above states. This widget displays a stacked chart for all tickets created over the date range you selected. The stacks indicate whether the ticket is Open, On hold, or Closed.

The example above shows that 3 tickets created on February 10th are still in the Open state.
Re-opened Tickets
This chart displays the number of reopened tickets for each day of the selected reporting period. Please keep in mind that these tickets may have been created anytime (inside or outside the reporting period).

Average Handle Time by Status
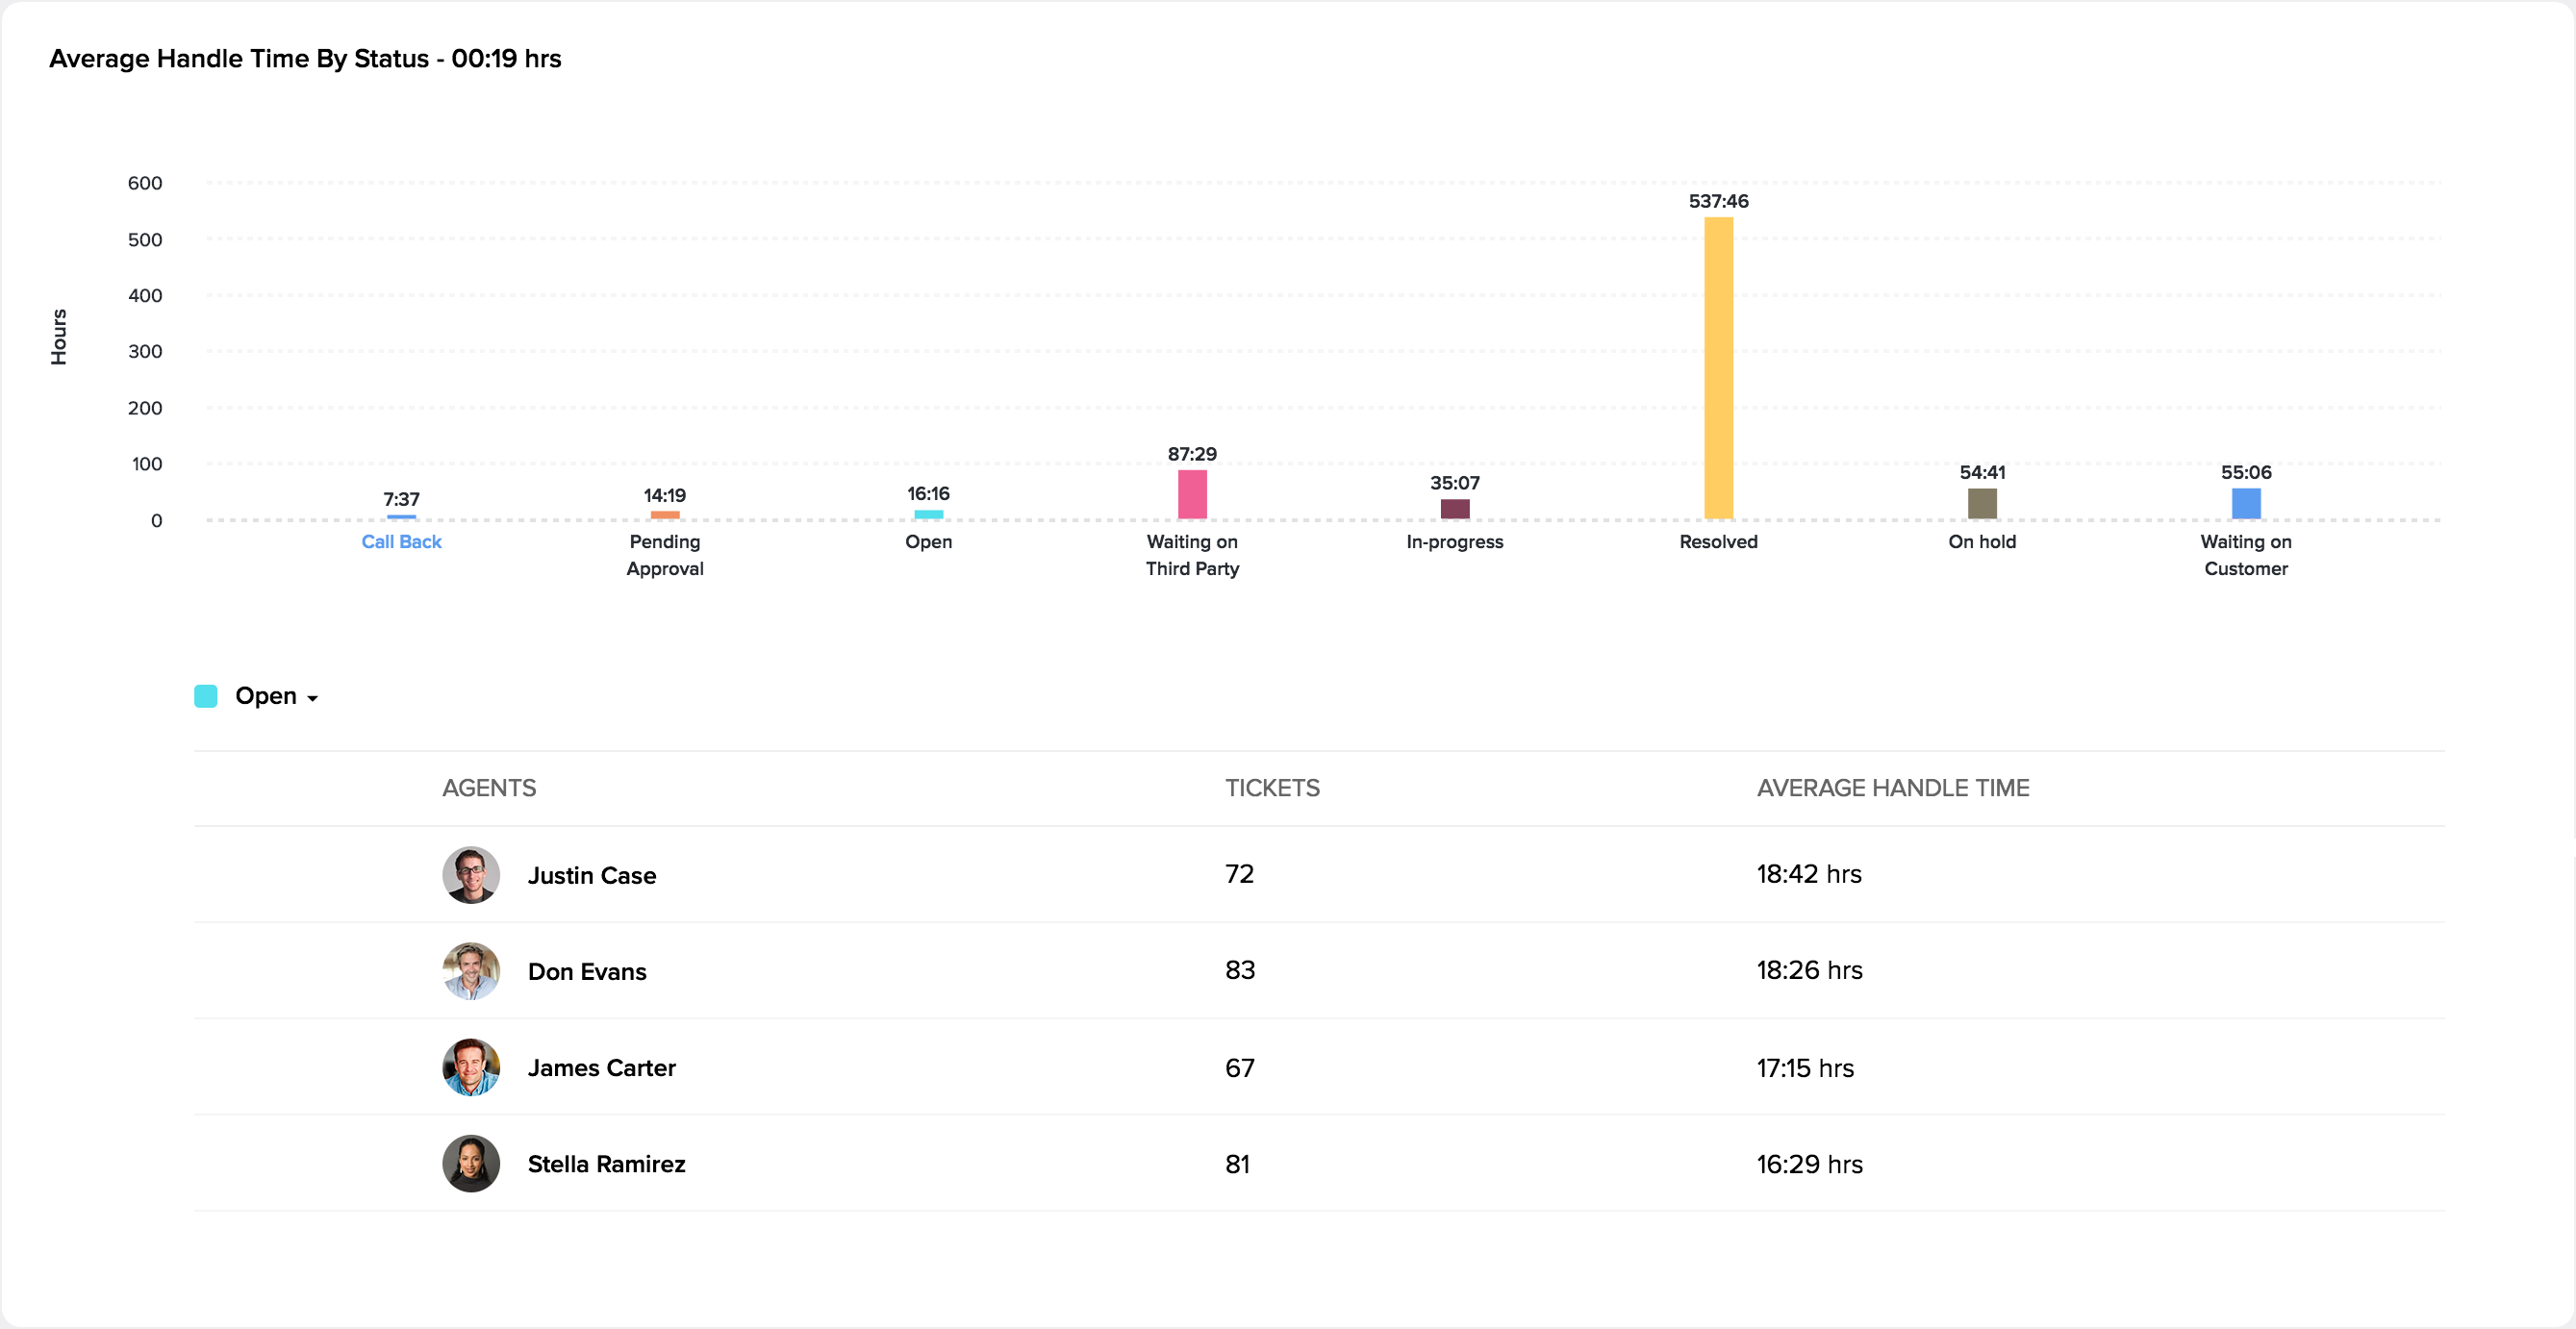
See how fast tickets move from creation to resolution in your current support process. Understand where the process slows down and improve those parts using the Average Handle Time report. This chart provides the average amount of time a ticket stays in each status. You can filter this data by agents to know how much time they spent on each status and their overall average time to resolution.

Using the Status Dashboard
By default, the Ticket Status dashboard will display metrics for all agents during the last 7 days. You can drill-in to view underlying data for each agent by selecting them from the drop-down list available at the top of the dashboard. Besides agents, you can filter dashboard data for the last 30 days, current week, last week, current month, last month, or custom reporting periods.
In addition to filters, you can perform the following actions by clicking the More Actions icon (  ) in the upper-right area:
- Export the dashboard when you have to work offline. You can export the dashboard as a .csv or .xls file.
- Print the dashboard or turn it into a PDF file via the print tools.
- Switch the dashboard to full-screen mode to fit the screen they're on.
Notes:
- The print option is not available for customers on the Zoho CRM Plus plan.
- Dashboard automatically refreshes every 15 minutes when on the full-screen mode. This is to ensure the latest data is displayed on TV screens, sharing links, etc.
Related Articles
Creating Dashboards
The Dashboard is a pictorial representation of your custom reports which gives a real-time snapshot of your organization's key metrics. Using dashboards, you can easily visualize the patterns and trends in tickets, channels, and happiness ...Ticket Status Lifecycle Extension for Zoho Desk
A ticket can go through various statuses once it gets created. For example, upon its creation, ticket status is Open. When an agent replies to the ticket, its status will change to Resolved. Similarly, if the customer responds to the same ticket, ...Understanding the Blueprints Dashboard
A support process is only effective when it’s adhered to, and when you know how each part is performing. As you streamline your support process using Blueprints, knowing whether it is implemented exactly as you’ve designed it and which parts need the ...Understanding the On hold ticket state
Ticket statuses help customers and agents to track progress and manage the lifecycle of a ticket. For example, it tells you whether it's the customer or an agent that needs to act next. All tickets in Zoho Desk can be in one of the following three ...Customizing Ticket Statuses
Typically, when customers submit support tickets, you assign them with a status that has been set up for your Zoho Desk. It will help you know the number of tickets that were resolved and those that are currently open. To begin with, you're provided ...