Comparators
A Comparator lets you compare your organization's data among users, roles and over different time periods. You can easily track information like sales teams performance over the years, number of deals lost or won in the consecutive months or individual sales reps performance through different sales stages. For example, if Zylker Inc. wants to view the sales metrics for each city, all it needs to do is select a Classic comparator and enter the relevant comparison parameters and get a comparative overview of Leads created, number of accounts, number of open deals and annual revenue generated by each city under one visualization.
Create a Comparator
Based on your business requirement you can choose the following comparators:
- Elegant
- Sport
- Classic
You can compare data among users, time period or modules.
- Users: You can select any CRM user or users from different roles.
- Time period: You can compare data against days, calendar weeks, fiscal weeks, month, fiscal quarter, year, or set custom date.
- Picklist values: You can choose picklist values from any module.
To create a comparator
- Click the Dashboards tab.
- In the Dashboard Builder page, select the dashboard in which the Comparator has to be added.
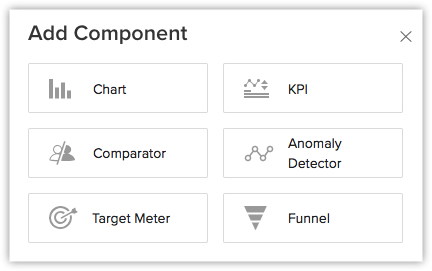
- Click Add Component.
- In the Add Component page, click the Comparator icon.
- In the Choose Comparator Style page, select a Comparator Style.
- In the next page, do the following:
- Enter the component name.
- Specify the Compare Among from the drop-down list.

- Click Add Your First Parameter and mention the Parameter Name, Metric and Duration.
- Click Done.
You can also add multiple parameters depending on your requirements.
- Enter the component name.
- Click Save.
Click Add & Reorder to add and rearrange the comparator in dashboard.

Note
- You can Clone, Edit, Delete, Print, Add to Home, Embed URL or Add a chart to favourite by clicking on the More icon in the component.
- You can choose "This Quarter" as the duration of a metric.
Related Articles
Analytical Components - Overview
Zoho CRM provides different types of analytics components for user dashboards. The list of components that the users can choose from is: Charts - Chart is a graphic representation of the user's data. It gives quick insights into records for easy ...Setting up Zoho Cliq Integration
When your manager wants to have a word with you regarding a potential customer and the possibility of winning a deal, you may not always prefer to sit in a conference room and discuss the details. When you want to give a quick update about the latest ...Slack
When your manager wants to have a word with you regarding a potential customer and the possibility of winning a deal, you may not always prefer to sit in a conference room and discuss the details. When you want to give a quick update about the latest ...Best CRM tools for your business to thrive remotely
The new era of work has redefined the way we operate, and do business. As new styles become prevalent, organizations are eagerly embracing co-working spaces, work from home, work on the go, and remote working as alternatives to traditional working ...